

Posted:
The daily struggle to stay informed about Corona in Munich
“So how is the Corona pandemic going in Munich?” A question I ask myself every day since 2 years. And answering that question is kind of complicated. You’d hope that our city authorities would happily share the data they have, explain what they see and how they think things are developing.
Well — they don’t, really. Here’s the official page. It has recently been stripped of a lot of (also historical) data and now shows the bare minimum, not even using the numbers the city has. Instead they copy/paste from RKI, the national institute that collects all data. With delays, and no updates over the weekend.
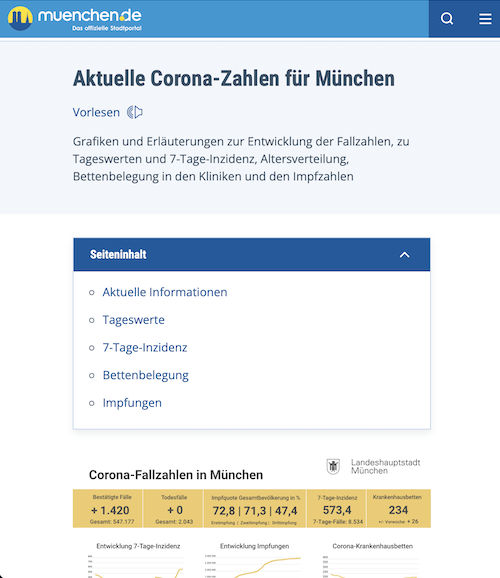 The few numbers the City of Munich shares
So already back in 2020, I got frustrated. And started to collect the numbers I could find at different places, put them together in a spreadsheet, made some nice graphs and shared them as replies whenever the City of Munich tweeted the daily numbers.
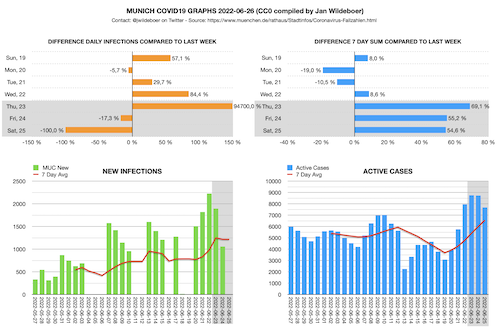 My own graphs, updated daily
I do this every day. Because it helps me and other people to stay informed. All data is made available CC0 licensed, of course. Why am I doing this? I actually like it. And two times I could prove with my numbers that the official numbers were way off, underreporting the real case numbers by half. It was corrected. My numbers helped fix that. Totally worth it.
It takes me around 15 minutes total per day. In the README on Github I list all the sources and what they add to the spreadsheet. This screenshot gives an impression of that.
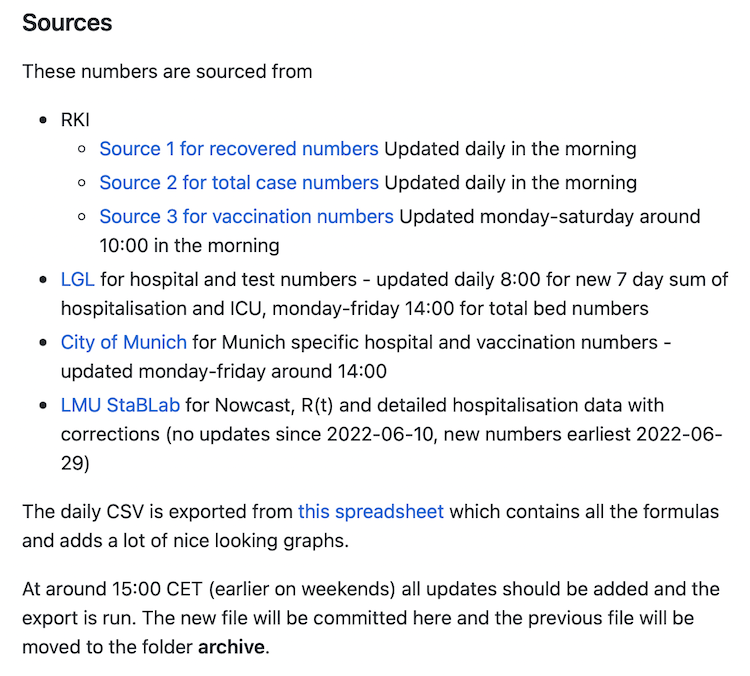 The README on Github
A few weeks ago, the City of Munich announced they would stop giving daily updates, removed a lot of their numbers from their website and left me astonished. But I don’t complain, I prefer to find solutions. Hence I created CoronaMUC on Twitter.
Where we continue to give daily updates, with explanations. Fact oriented, leaving emotions out. The people of Munich seem to like our approach, so I will continue. Every day.
So every morning I go through various sources, combine numbers, do some calculations, update my spreadsheet, export as CSV, upload that to my github repo, update the dashboard, tweet it and drink coffee.
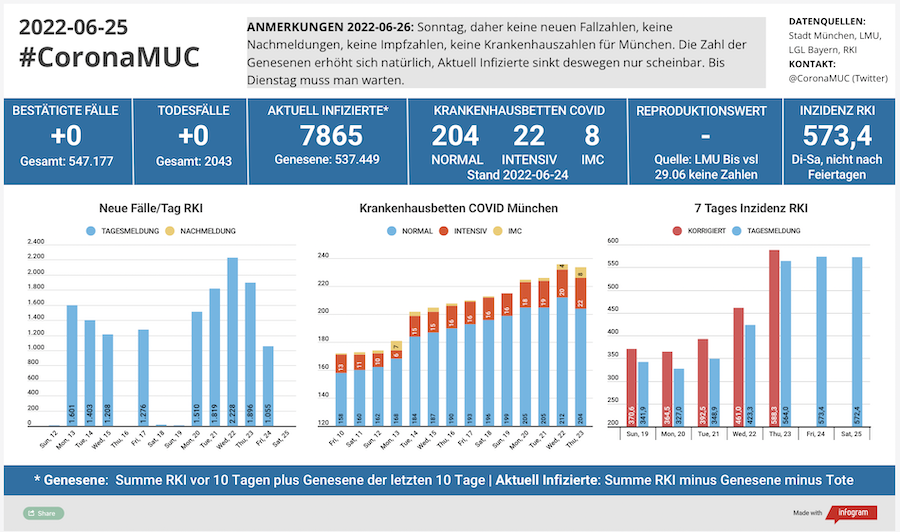 Our own dashboard
The github repo, where I put the numbers as CSV, every day, with an archive folder, is here. Of course CC0 licensed. It’s #OpenData.
That’s how you stay updated on Corona in Munich. You follow CoronaMUC on Twitter. Because our authorities have more or less given up and the data is not really easy to find and combine. Someone has to do it, IMHO. So for Munich, it’s us, the very small team of volunteers behind @CoronaMUC. You’re welcome :)
COMMENTS
You can use your Mastodon or other ActivityPub account to comment on this article by replying to the associated post.